I have spent a lot of the last week pondering the distribution of information and the presentation of data.
Coming from a mathematics and science background, I am quite at home with numbers, and would prefer to read a budget then a written report, however I know that most of the general population have more trouble grasping numbers, and possibly because of this, mainstream media reporting focus on qualitative rather than quantitative results and issues. I feel that this has lead to some rather important gaps in public knowledge, and some horrifying misconceptions.
For example, this graph has had me captivated from the instant I saw it:
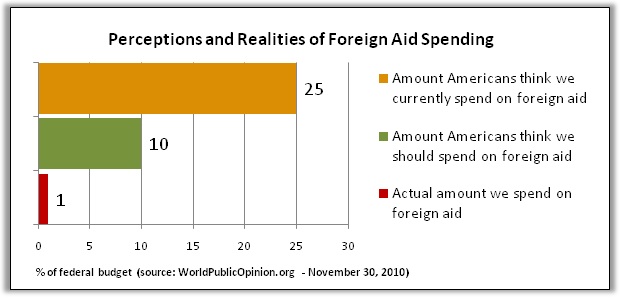 While most respondents thought they were advocating for less international aid, we could actually increase US aid money significantly, and still be satisfying the public. That the public thinks America spends 25% of it's budget on aid is a failure of media reporting. Methodology here.
I posted a few weeks ago about the Japanese nuclear crisis, there again we saw public panic due to misinformation - people failed to understand that the radiation numbers spoken about were tiny.
One solution to this public ignorance? Make data more accessible and in a format that is easier for the layman to understand. I am going to spend the rest of this post highlighting and applauding efforts to do just that. Hats off to these fantastic efforts.
I start with the wonderful website Information is Beautiful which I could easily spend hours on. One of the best tools is the animation below which puts large financial numbers into perspective. This is the one that those people from the survey above should have seen!
Other gems include: the true size of Africa, the billion-dollar-o-gram, What does China censor?, global fears, and their TED talk.
Another champion of the data is Swedish Global Health Lecturer Hans Rosling, who, as well as giving several really excellent TED talks (most recent), pioneered the fantastic GapMinder tool (demo here), which allows the user to select their variables and watch their interactive graph evolve with the world, a screenshot is below:
 Datamarket has a similar tool to Gapminder, but it is not aimed at development specifically. GoogleInsights is also great for playing with data, for example, notice a correlation between terror alerts and elections?
Another worthy website is FlowingData, which again have a wide range of visualisations, and links to even more, such as a map of refugee flows, a graph showing that 40% of over 70s have sex, and the below chart of Faith and Poverty. The site also has lots of information for making your own graphics. If you are looking for the raw data to work with, try Timetric, an aggregate of the world's leading sources of economic data, try Here for lots of governement data about London, or Infochimp of an assortment of datasets. Another diverse and growing set of data available at MEDevEcon (h/t to AidThoughts). Patrick Cain produces interesting maps for just about every social variable in Canadian cities.


If people are seeking a little daily data burst, I'd recommend signing up to the Economist's Daily Chart RRS feed, interesting recent graphs include: Regional Inequality, Representation of Women, and the below chart on Child Brides. I would similarly recommend The Guardian's Data Blog, which also have interesting visualisation of government spending and a really useful timeline for the middle east protests (seriously!).

Finally, as unrelated yet interesting aside, check out OkCupid for data trends from a huge online dating site. Hits include: the lies people tell when online dating, the case for an older women, and finally, Gay vs. Straight sex. Enjoy.
Coming from a mathematics and science background, I am quite at home with numbers, and would prefer to read a budget then a written report, however I know that most of the general population have more trouble grasping numbers, and possibly because of this, mainstream media reporting focus on qualitative rather than quantitative results and issues. I feel that this has lead to some rather important gaps in public knowledge, and some horrifying misconceptions.
For example, this graph has had me captivated from the instant I saw it:
I posted a few weeks ago about the Japanese nuclear crisis, there again we saw public panic due to misinformation - people failed to understand that the radiation numbers spoken about were tiny.
One solution to this public ignorance? Make data more accessible and in a format that is easier for the layman to understand. I am going to spend the rest of this post highlighting and applauding efforts to do just that. Hats off to these fantastic efforts.
I start with the wonderful website Information is Beautiful which I could easily spend hours on. One of the best tools is the animation below which puts large financial numbers into perspective. This is the one that those people from the survey above should have seen!
Other gems include: the true size of Africa, the billion-dollar-o-gram, What does China censor?, global fears, and their TED talk.
Another champion of the data is Swedish Global Health Lecturer Hans Rosling, who, as well as giving several really excellent TED talks (most recent), pioneered the fantastic GapMinder tool (demo here), which allows the user to select their variables and watch their interactive graph evolve with the world, a screenshot is below:

Another worthy website is FlowingData, which again have a wide range of visualisations, and links to even more, such as a map of refugee flows, a graph showing that 40% of over 70s have sex, and the below chart of Faith and Poverty. The site also has lots of information for making your own graphics. If you are looking for the raw data to work with, try Timetric, an aggregate of the world's leading sources of economic data, try Here for lots of governement data about London, or Infochimp of an assortment of datasets. Another diverse and growing set of data available at MEDevEcon (h/t to AidThoughts). Patrick Cain produces interesting maps for just about every social variable in Canadian cities.
The infographic is appearing as the new information transmitter of choice, and consists of standard graphs or tables overlain with maps, pictures or symbols to tell a story. Examples can be found at Good, such as the Quest to Power in Africa below:
If people are seeking a little daily data burst, I'd recommend signing up to the Economist's Daily Chart RRS feed, interesting recent graphs include: Regional Inequality, Representation of Women, and the below chart on Child Brides. I would similarly recommend The Guardian's Data Blog, which also have interesting visualisation of government spending and a really useful timeline for the middle east protests (seriously!).
Finally, as unrelated yet interesting aside, check out OkCupid for data trends from a huge online dating site. Hits include: the lies people tell when online dating, the case for an older women, and finally, Gay vs. Straight sex. Enjoy.
It's the weekend, and so time to browse through the blog you just linked me to...
ReplyDeleteSome interesting stuff on here. Glad you enjoyed the Mandela book and got something out of it :)